P-T Diagram
Saturation Dome
Region on T-v diagram or P-v diagram bounded by saturated liquid line (left) and saturated vapour line (right).
The mixture region lies under the dome.
Phase Diagram
A graph of pressure vs. temperature. Represents the conditions under which a substance exists in a each phase.
Fusion Line
Boundary line between solid and liquid phases. Represents the conditions at which a substance melts or freezes.
Evaporation Line
Boundary line between liquid and gas phases. Represents the conditions under which a substance boils or condenses.
Sublimation Line
Boundary between the solid and gas phases. Represents the conditions under which a substance sublimes (solid to gas) or deposits (gas to solid).
Critical Line
The line that ends at the critical point, beyond which the liquid and gas phases become indistinguishable; it represents the highest temperature and pressure at which a liquid and its vapor can coexist.
Critical Point
A unique set of temperature and pressure at which the distinction between liquid and gas phases disappears. Denoted as (, ). Here is the critical temperature and is the critical pressure.
Above the critical point, the substance exists as a supercritical fluid.
Triple Point
A unique set of temperature and pressure at which all 3 phases of a substance coexist in equilibrium.
T–v Diagram
Graph of temperature vs. specific volume. Used to visualize phase changes at a given pressure. Temperature remains constant under the dome.
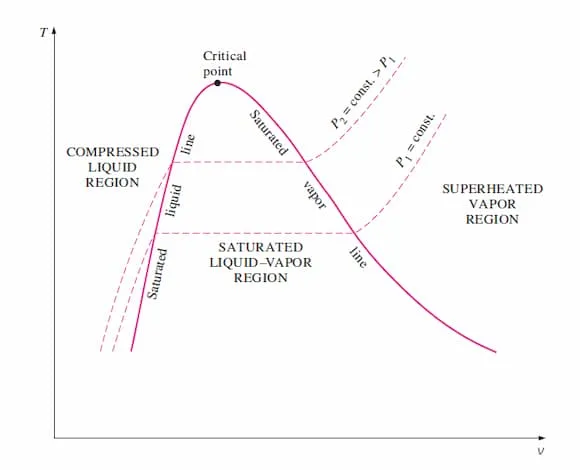
Image from lecturer’s slides
- In the compressed liquid region, temperature rises with a small volume change.
- At the saturated liquid line, temperature is fixed at and boiling begins.
- Under the dome, temperature stays constant while volume increases as increases.
- At the saturated vapour line, the phase change is complete.
- In the superheated region, both temperature and volume rise.
- Critical point is the peak of the dome.
Isobar
Line of constant pressure. Bend upward.
P–v Diagram
Graph of pressure vs. specific volume. Used to visualize phase change at a given temperature. Pressure remains constant under the dome.
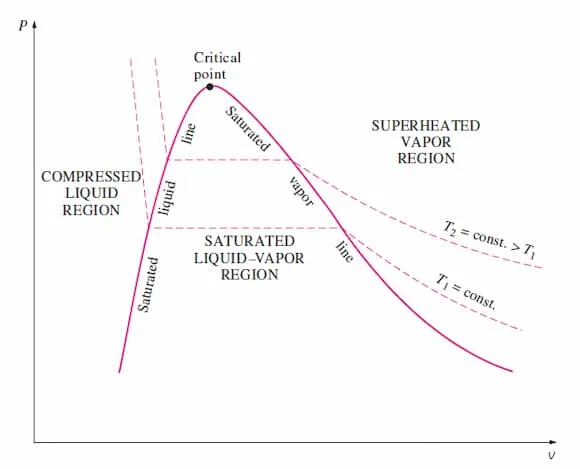
Image from lecturer’s slides
Saturation dome similar to T–v diagram but curved differently.
Under the dome: mixture region with constant-pressure lines.
- During boiling at fixed temperature, pressure stays constant.
- Specific volume increases sharply across the mixture region.
- The flat segment length relates to the latent heat.
Isotherm
Line of constant temperature. Bend downward.
- At : isotherm cuts across dome in a horizontal line, representing constant-pressure phase change.
- At : no flat region; fluid behaves as a supercritical gas.
P-v diagrams are mostly used to visualize isothermal processes. Constant-temperature lines help interpret behaviour of real fluids compared to ideal gases.
P-v-T Surface
Substance that Contracts on Freezing
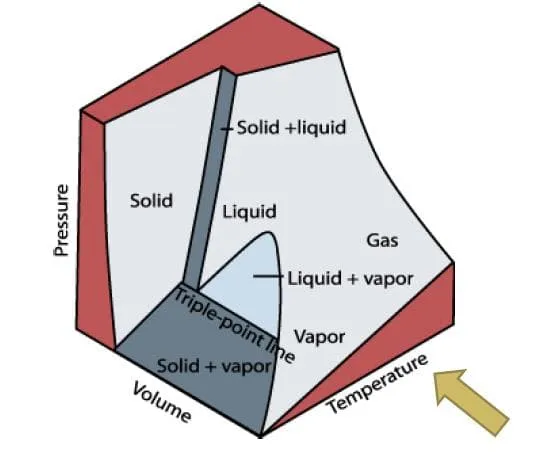
Image from lecturer’s slides
Substance that Expands on Freezing
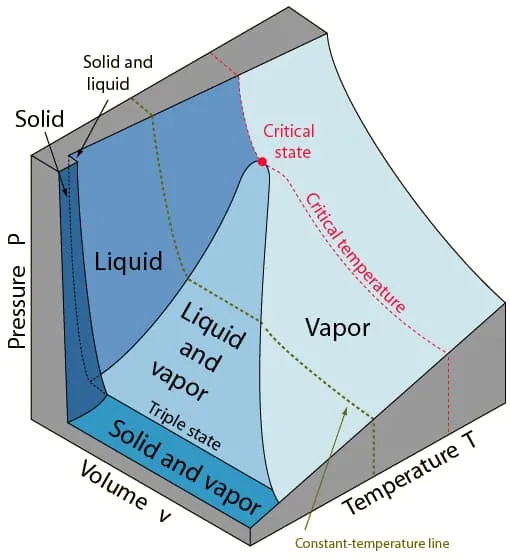
Image from lecturer’s slides